Mapping Brand Strategy: Balancing Centrality Vs Distinctiveness
This is one of our free-to-access content pieces.
To gain access to all Ideas for Leaders content please Log In Here
or if you are not already a Subscriber then Subscribe Here.
Main Image
KEY CONCEPT
A new tool, based on scoring brands on their centrality (i.e. the brand of record) and distinctiveness (i.e. the brand that stands out from the crowd) can help marketers and strategists determine the best paths for growth and profitability.
IDEA SUMMARY
Companies struggle with two apparently contradictory goals. They want their brands to be central in their category — in other words, the brand of record, similar to the position held by Coca-Cola in the soda category or McDonald’s in fast food. At the same time, however, they want their brands to be distinctive, standing out from the crowd.
In the end, companies must find the right balance of centrality and distinctiveness that is most profitable for them. What is this balance, however, and how does one achieve it?
Two researchers from Canada’s Ivey Business School have introduced a new tool that answers these questions. This tool, the central-distinctiveness (C-D) map, works because it allows companies to analyse both brand positioning and business performance. Traditional information on brand positioning is acquired through perceptual positioning maps; for example, consumers are asked to rate the product based on two, opposing dimensions (say, budget vs. premium). Information on business performance is acquired through typical performance metrics, such as market share or profitability.
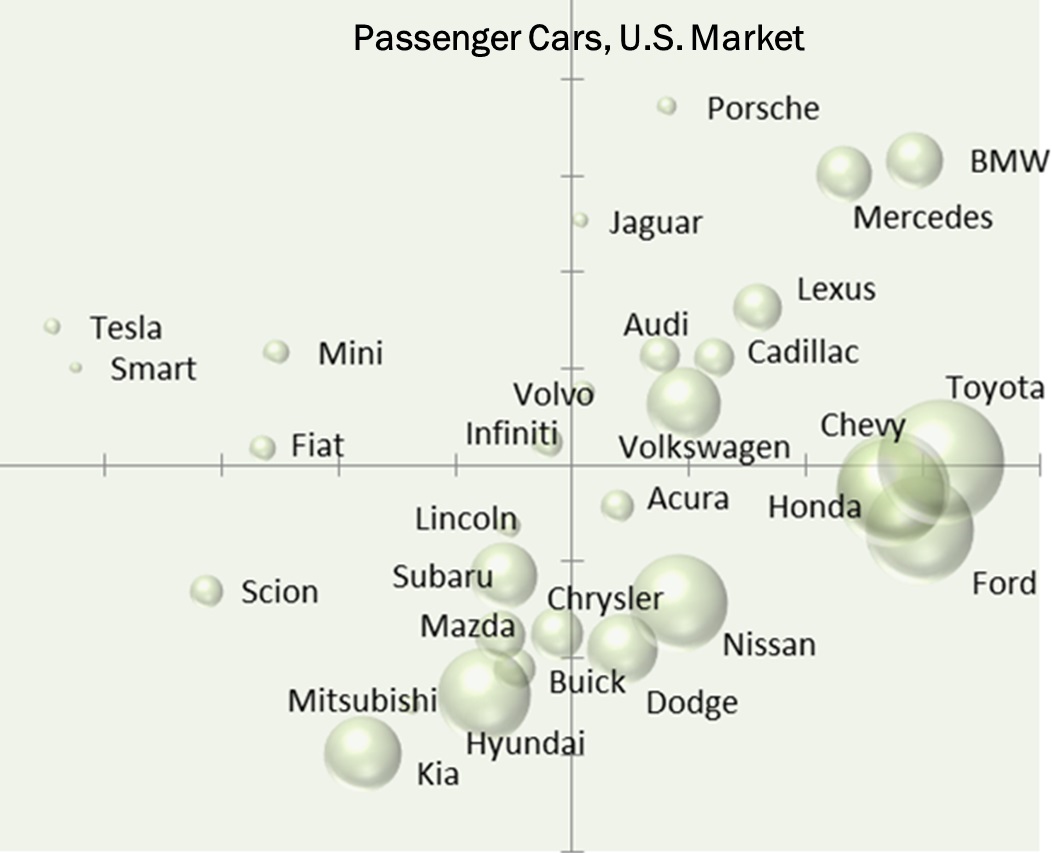
The central-distinctiveness map connects brand perceptions and business performance. An example using the car market can illustrate how this works. Imagine a chart for this market with an x-axis that represents distinctiveness and a y-axis that represents centrality. Some cars, such as BMW or Mercedes, score high on both distinctiveness and centrality (the upper right quadrant of the C-D map). Other cars, such as Nissan or Ford, score high on centrality but low on distinctiveness (the lower right quadrant). At the other end of the scale are cars, such as the Mini or the electric Tesla, that score low on centrality but high on distinctiveness (upper left quadrant). And finally, some cars, such as Kia, score low on both centrality and distinctiveness (lower left quadrant). The C-D map not only positions the perceptions of the car brands based on centrality and distinctiveness, but also shows through the size of the circle on the map the business performance of the brands. Thus, BMW would have a relatively small circle to represents its relatively small sales compared to Ford, whose circle is much larger.
With the high-low dichotomy for each of the two metrics, the chart can be broken into four quadrants. High centrality and distinctiveness is the aspirational quadrant: brands are differentiated but have a wide appeal. The high distinctiveness but low centrality quadrant can be labelled as unconventional. The low distinctiveness but high centrality, on the other hand, is the mainstream quadrant. And, finally, in the low centrality and low distinctiveness quadrant, are the peripheral brands, with little to distinguish them.
BUSINESS APPLICATION
With their brands in place on the C-D map, company strategists and marketers can better understand where they stand today and how to move forward. For example, higher centrality means a higher sales volume, but a lower price. Toyota, the car brand with the highest centrality score, sold one million cars. High distinctiveness, on the other hand, reflects lower sales but higher prices. The most distinctive car on the chart, Porsche, is also the most pricey (in terms of average base retail price).
One can see the implications. One company might be happy with the positioning of its brand — Porsche is perfectly happy to be distinctive and pricey — while another company might want to move in the direction of a different quadrant. Seeking to increase its sales volume, the highly distinctive Tesla, for example, would like to move toward more centrality.
Any movement has an immediate impact. For cars, moving one percentage point up the centrality score means 200,000 more cars sold per year; moving one percentage point up the distinctiveness score means an average price increase of $12,900.
Each of the four quadrants has strategic implications for the brands within it. Both distinctive and central, brands in the aspirational quadrant benefit from high sales and premium pricing. The challenge is to fight off competitors coming from the more distinctive unconventional quadrant or more central mainstream quadrant. As for mainstream brands, they need to be wary of unconventional brands that might become more central as consumers shift their preferences to new technology.
Peripheral brands are undistinguished but can survive through their low-cost business models. Since they are not putting money into marketing or innovation, for example, they do not need the sales of more central brands or the higher prices of more distinctive brands. Unconventional brands are niche players; if they want to grow, they must become more central.
In sum, the central-distinctive map helps companies assess the strengths and weaknesses of the brand and whether to stay in place or find the strategies that will help them move to a more advantageous quadrant.
Ideas for Leadersis a free-to-access site. If you enjoy our content and find it valuable, please consider subscribing to our Developing Leaders Quarterly publication, this presents academic, business and consultant perspectives on leadership issues in a beautifully produced, small volume delivered to your desk four times a year.